CKMath Unit 6: Associations in Data
Focus:
In this unit, students analyze bivariate data—using scatter plots and fitted lines to analyze numerical data, and using two-way tables, bar graphs, and segmented bar graphs to analyze categorical data.
The unit begins with an investigation of a table of data. Measurements of a leg and perimeter of an isosceles right triangle are shown in each row, but column entries are not in order, making it hard to discern a pattern. Students manipulate the data to look for patterns in the table (MP7), then examine a scatter plot of the same data. This motivates the need to use different representations of the same data to find and analyze any patterns.
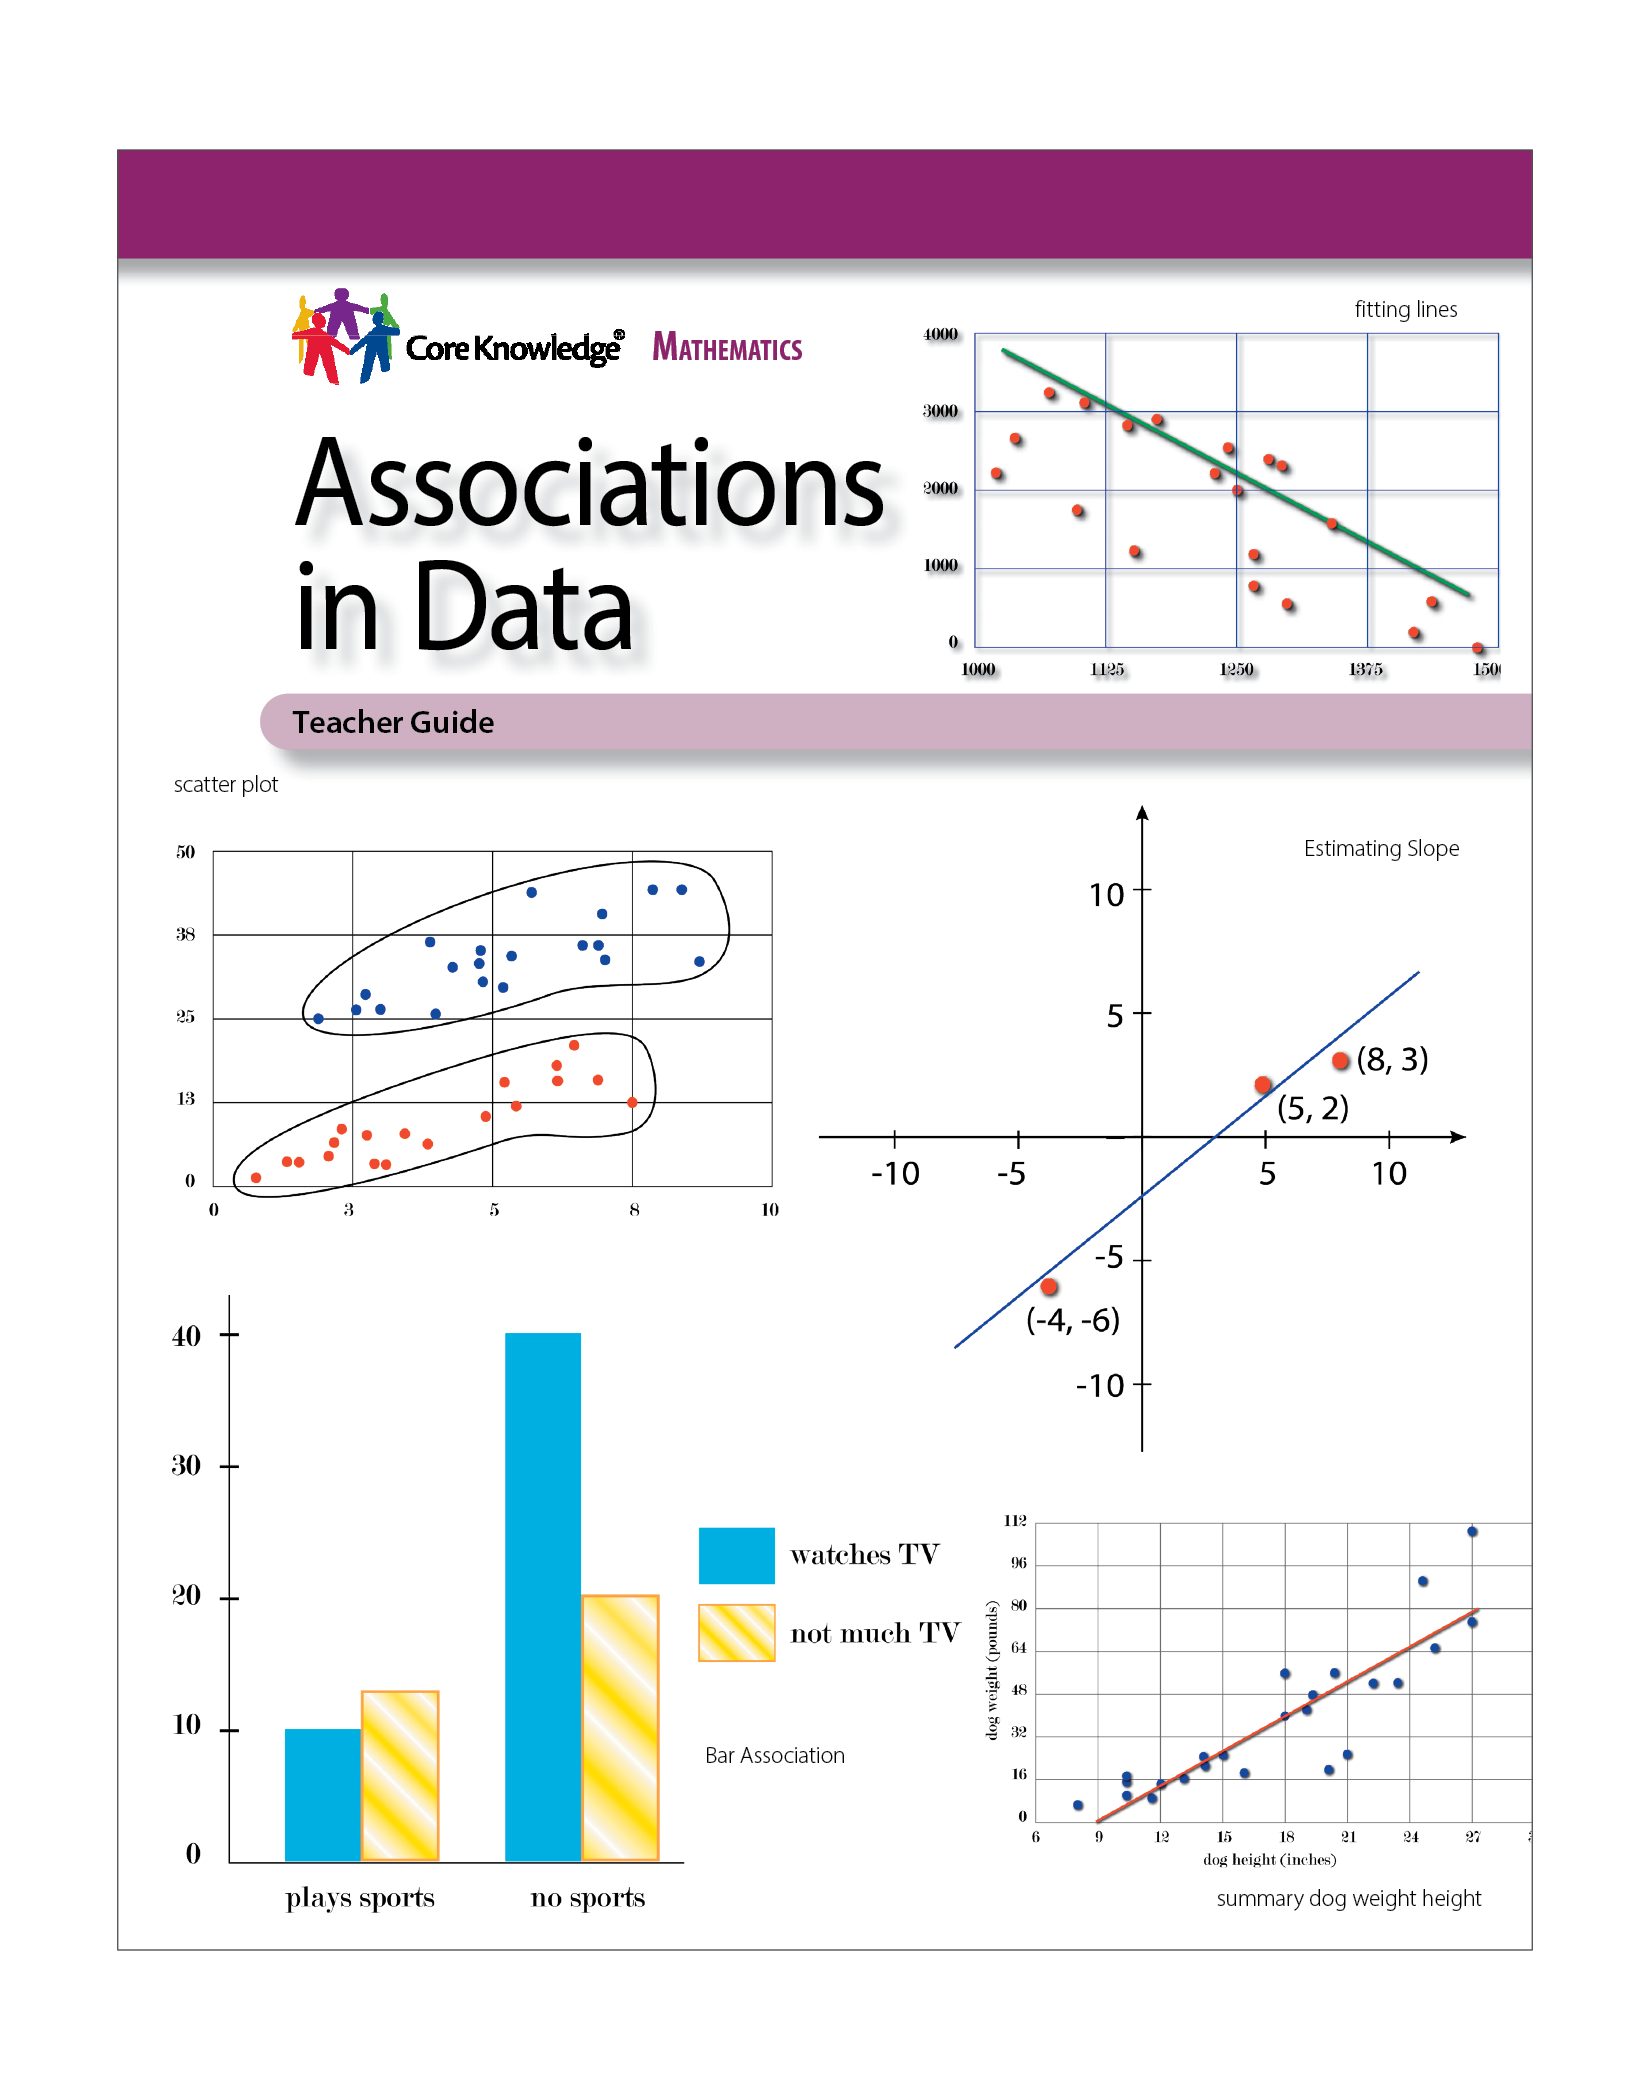
The second section focuses on using scatter plots and fitted lines to analyze numerical data. Students make and examine scatter plots, interpreting points in terms of the quantities represented (MP2) and identifying scatter plots that could represent verbal descriptions of associations between two numerical variables (MP1). They see examples of how a line can be used to model an association between measurements displayed in a scatter plot and they compare values predicted by a linear model with the actual values given in the scatter plot (MP4). They draw lines to fit data displayed in scatter plots and informally assess how well the line fits by judging the closeness of the data points to the lines (MP4). Students compare scatter plots that show different types of associations (MP7) and learn to identify these types, making connections between the overall shape of a cloud of points and trends in the data represented, e.g., a scatter plot of used car price vs. mileage shows a cloud of points that descends from left to right and prices of used cars decrease with increased mileage (MP2). They make connections between the overall shape of a cloud of points, the slope of a fitted line, and trends in the data, e.g., “a line fit to the data has a negative slope and the scatter plot shows a negative association between price of a used car and its mileage.” Outliers are informally identified based on their relative distance from other points in a scatter plot. Students examine scatter plots that show linear and non-linear associations as well as some sets of data that show clustering, describing their differences (MP7).
The third section focuses on using two-way tables to analyze categorical data (MP4). Students use a two-way frequency table to create a relative frequency table to examine the percentages represented in each intersection of categories to look for any associations between the categories. Students also examine and create bar and segmented bar graphs to visualize any associations.
The unit ends with a lesson in which students collect and analyze numerical data using a scatter plot, then categorize the data based on a threshold and analyze the categories based on a two-way table (MP4).
Number of Lessons: 10 and 1 optional
Instruction Time:
Approximately 50 minutes
(Please note that each lesson is designed for one instructional block, and may be divided into shorter or longer segments based on teacher pacing and student needs.)